

I’d use CSAT to check satisfaction, CES to find task friction, and NPS to track willingness to recommend. Start with the question you need answered – not all three surveys.
An easy checkout doesn’t mean a customer will recommend you. And a satisfied support customer may still leave. That’s why I read each score alongside customer comments and behavior, such as checkout abandonment or repeat support contacts.
Quick Comparison
| Metric | What it measures | When I’d ask | How it’s scored |
|---|---|---|---|
| CSAT | Satisfaction with one interaction | Soon after checkout or support | Percentage satisfied; often ratings of 4–5 on a 1–5 scale |
| NPS | Willingness to recommend | On a fixed schedule, such as quarterly | Percentage rating 9–10 minus percentage rating 0–6; ranges from −100 to 100 |
| CES | Ease or difficulty of one task | After completion or a failed attempt | Average rating on a 1–5 or 1–7 scale; state which direction means easier |
<u>Compare trends within each metric – not the three score scales against each other.</u> I’d keep survey wording, timing, and scoring consistent, report response counts and rates, and check customer groups separately when samples allow. Then I’d assign effective leaders as owners and compare scores with behavior before and after changes.
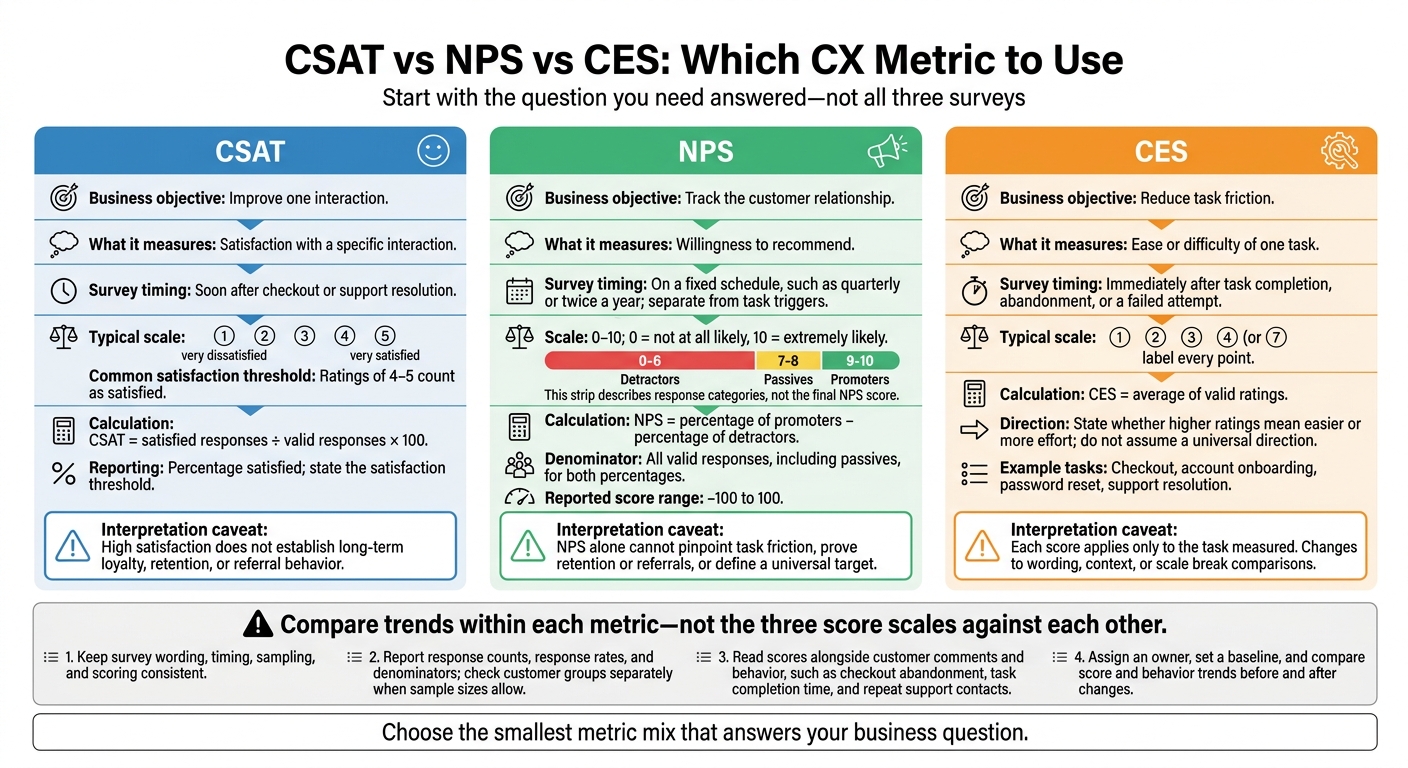
CSAT vs NPS vs CES: Which CX Metric to Use
Master Customer Experience Metrics: NPS, CSAT, CES Explained
sbb-itb-2fdc177
What CSAT, NPS, and CES Measure
Each metric answers a different question. The table below shows what each measures and when to use it.
| Metric | Measured experience | Typical scale | Reporting method |
|---|---|---|---|
| CSAT | Satisfaction with a specific interaction | 1–5 | Percentage of responses meeting the defined satisfaction threshold |
| NPS | Willingness to recommend | 0–10 | Percentage of promoters minus percentage of detractors |
| CES | Ease or difficulty of a task | 1–5 or 1–7 | Average of valid ratings, with scale direction stated |
CSAT: Satisfaction With an Interaction
Ask immediately after a specific interaction, such as checkout or support resolution. A common scale runs from 1 = very dissatisfied to 5 = very satisfied. If ratings of 4–5 count as satisfied, CSAT = satisfied responses ÷ valid responses × 100.
Add an optional comment field so customers can explain their rating. Report the percentage, valid-response count, survey period, touchpoint, segment, and satisfaction threshold.
| Area | What leaders should know |
|---|---|
| Suitable digital touchpoints | Completed checkout, account onboarding, and support resolution |
| Reporting value | Supports comparisons by channel, issue type, device, or resolution status |
| Recency bias | The latest event or outcome can dominate the rating |
| Response bias | Respondents may not represent all customers |
| Inconsistent thresholds | Switching from ratings 4–5 to 5 only creates artificial changes |
| Loyalty limitation | High satisfaction does not establish long-term loyalty, retention, or referral behavior |
NPS: Willingness to Recommend
Use the standard 0–10 recommendation question, where 0 = not at all likely and 10 = extremely likely. Calculate NPS = percentage of promoters − percentage of detractors and report a score from −100 to 100. Use all valid responses, including passives, as the denominator for both percentages.
Survey quarterly or twice a year. Keep sampling and timing consistent to track trends, rather than diagnose a single task. Add a reason-for-score question to understand the rating. NPS alone cannot pinpoint friction, prove retention or referrals, or define a universal target.
| Response category | Score range | Interpretation | Follow-up action |
|---|---|---|---|
| Promoters | 9–10 | Strong recommendation intent | Thank them; request testimonial or case-study permission where appropriate |
| Passives | 7–8 | Limited enthusiasm | Identify improvements to value or convenience |
| Detractors | 0–6 | Negative sentiment | Start recovery; route root causes to the responsible team |
CES: Ease or Difficulty of a Task
Ask after one specific task, such as resetting a password. Label every point on the 1–5 or 1–7 scale, and state whether higher ratings mean easier or more effort. When reporting an average, CES = average of valid ratings.
Collect feedback immediately after completion or abandonment. Document the question wording, scale direction, denominator, timing, and how you handle incomplete responses. Each score applies only to the task measured. Changes to wording, context, or scale break comparisons.
| Digital task | Survey moment | Friction signal | Responsible team | Supporting behavioral measure |
|---|---|---|---|---|
| Checkout | After payment succeeds or the user abandons checkout | Confusing fields, payment errors, or repeated attempts | E-commerce, product, and payments | Completion rate, abandonment rate, time to purchase, payment-error rate |
| Account onboarding | After registration or a first-value milestone | Difficulty verifying identity, importing data, or understanding next steps | Product, UX, and identity/security | Activation rate, time to activation, step drop-off, help-center visits |
| Password reset | After successful reset or a failed attempt | Repeated errors or inability to locate recovery options | Product, engineering, and security | Reset completion, retry count, time to completion, contact rate |
| Support resolution | Immediately after ticket closure or self-service resolution | Customers must repeat information or contact support again | Support, knowledge management, and product | Resolution time, repeat-contact rate, escalation rate, article success rate |
Read CES alongside these behavioral measures, rather than treating the survey score as the whole story.
When higher scores mean easier, a falling checkout score accompanied by rising abandonment and longer task time gives stronger evidence of friction than the survey result alone. Likewise, easier support resolution paired with fewer repeat contacts helps show whether process changes are working.
These differences provide the basis for the side-by-side comparison that follows.
CSAT vs NPS vs CES: How They Compare
Keep wording, scales, samples, and survey windows consistent within each metric. That way, score changes reflect customer experience (CX), not changes in survey design.
Match Metrics to Business Decisions
Use CSAT to fix interactions, CES to reduce task friction, and NPS to track customer relationships. Read CSAT and CES at the interaction level and NPS at the relationship level.
Keep Reporting Rules Consistent
Apply the same reporting rules to all three metrics so you can compare results across channels and segments. That doesn’t mean comparing their different score scales directly.
- Report the response count, response rate, and denominator for each metric.
- Segment results by device, journey stage, tenure, and customer group when sample sizes are large enough.
Review trends by metric, segment, and journey stage. Once reporting rules are set, assign ownership and decide how often to send surveys.
Choose and Manage Your Metric Mix
Start with the decision you need to make. Then choose the smallest metric mix that answers it.
A small organization can start with CSAT for one priority interaction or CES for one known friction point. Add NPS once the sample size supports stable reporting.
Match Survey Timing to Business Goals
| Business objective | Preferred metric | Survey moment |
|---|---|---|
| Improve one interaction | CSAT | Soon after the interaction ends |
| Reduce task friction | CES | Immediately after the task or attempt |
| Track the customer relationship | NPS | On a fixed cadence, separate from task triggers |
Keep Survey Cadence Consistent
Send NPS on a fixed schedule – not after every task. For abandoned journeys, pair survey results with behavior data. Survey results alone cannot explain abandonment.
Conclusion: Choose Metrics That Answer Your Questions
No single metric tells the whole digital CX story. Read results alongside customer comments and behavioral data, and keep survey design consistent.
Keep only metrics that answer a defined business question. Once you’ve chosen the mix, decision owners should use the data to set priorities.
Set a baseline before making changes. Then compare score and behavior trends over time to assess impact and find the biggest CX gaps.
FAQs
What should I do when CSAT, NPS, and CES tell different stories?
CSAT measures satisfaction with an interaction, CES pinpoints friction, and NPS gauges long-term loyalty. When these scores differ, customers may be happy with one touchpoint but unhappy with the overall relationship – or the other way around.
Pair these metrics with behavioral data and customer feedback. Use consistent definitions, keep data in one place, and compare scores with support tickets, usage patterns, or churn rates. Review the findings across teams to understand the context. If several signals point to customer pain, prioritize immediate outreach and escalation.
How many survey responses do I need for reliable results?
A recommended best practice is to collect at least 50 survey responses within a 7-day period before triggering alerts or making major decisions about how you run your business. This threshold helps your metrics reflect actual trends – not random noise, low-traffic spikes, or statistical anomalies.
How can I measure CX without causing survey fatigue?
Don’t rely only on long surveys – they often get low response rates. Instead, use micro-surveys at key touchpoints, like checkout or pricing pages, to get feedback at the right moment. Collect passive feedback from support tickets, social media monitoring, and app reviews, too.
Close the feedback loop by showing customers what you changed based on their input. Customers are 21% more likely to participate in future surveys when they see their feedback leads to improvements they can see or experience.